Cloud — An Optional Private Copy, Off-Site
Cloud is the optional last step in the pipeline. Everything works without it — your sensors report to your hubs, and Local gives you full analysis and ownership on site. Cloud adds one thing: a private copy of your data, off-site, for when you’re not standing in the shed.
It’s still your data. “Cloud” here means a copy you control, kept somewhere you can reach from anywhere — not a SaaS account that owns your readings and rents them back to you.
A glimpse of what OGLASCloud gives you — tap any screen for a closer look:
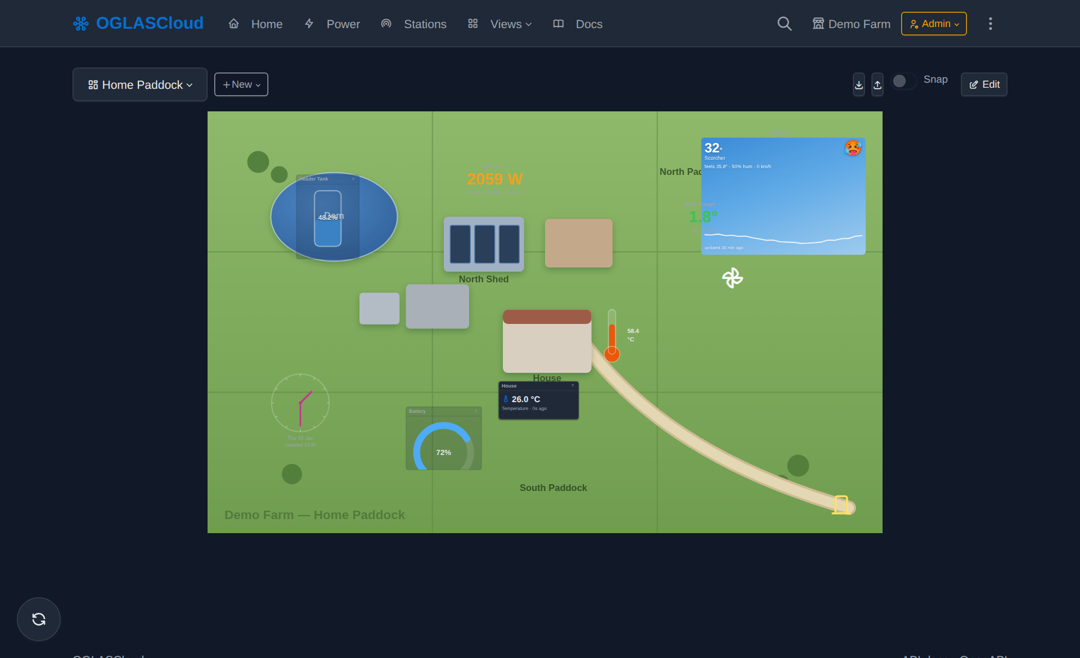 Spaces — draw your property, drop live widgets where the real things are
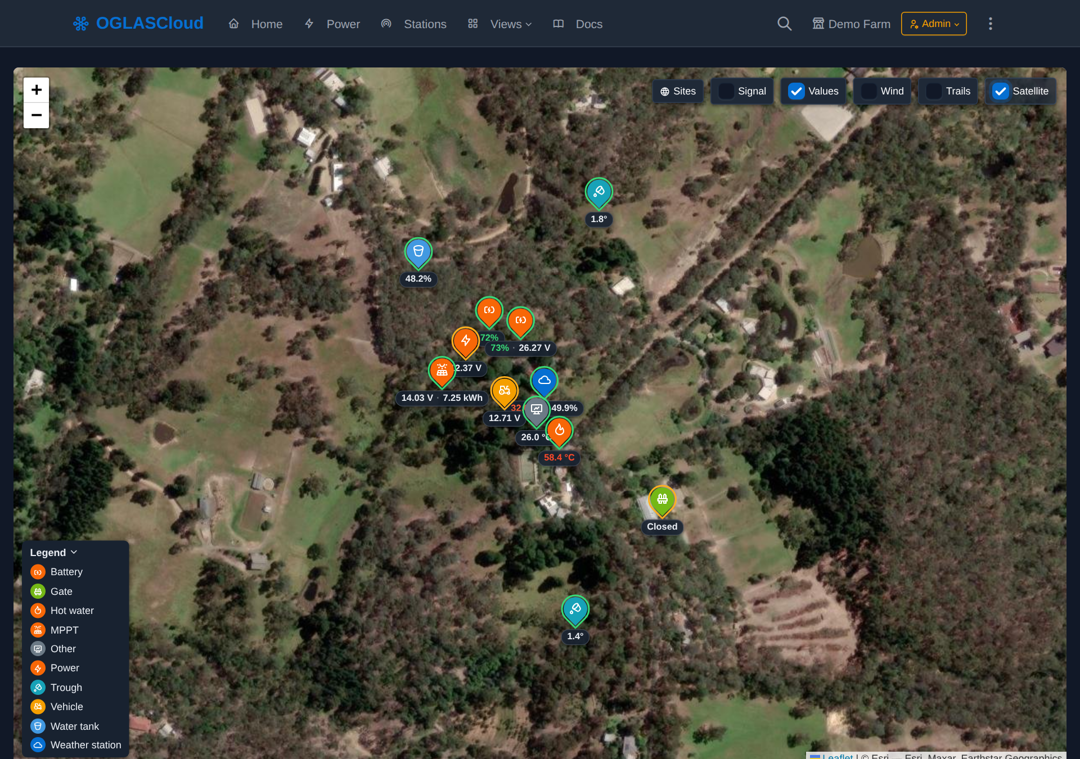 The live Map — every station on satellite, values on the pins
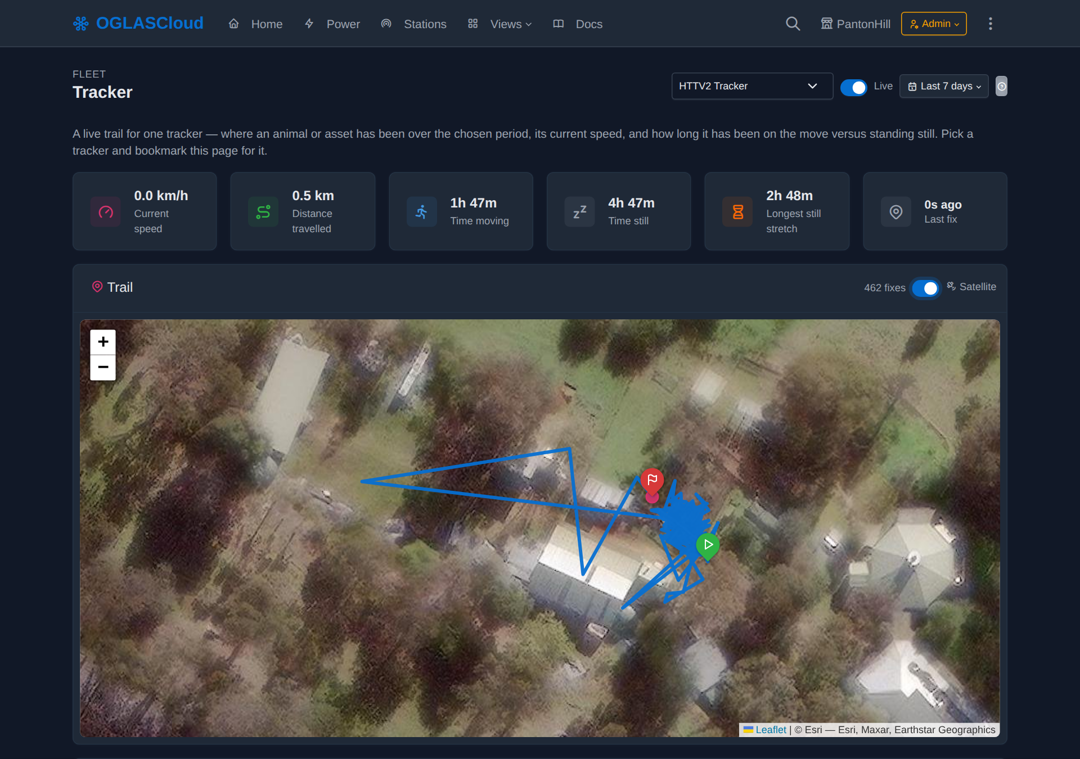 Tracker — a vehicle's real trail on satellite, live
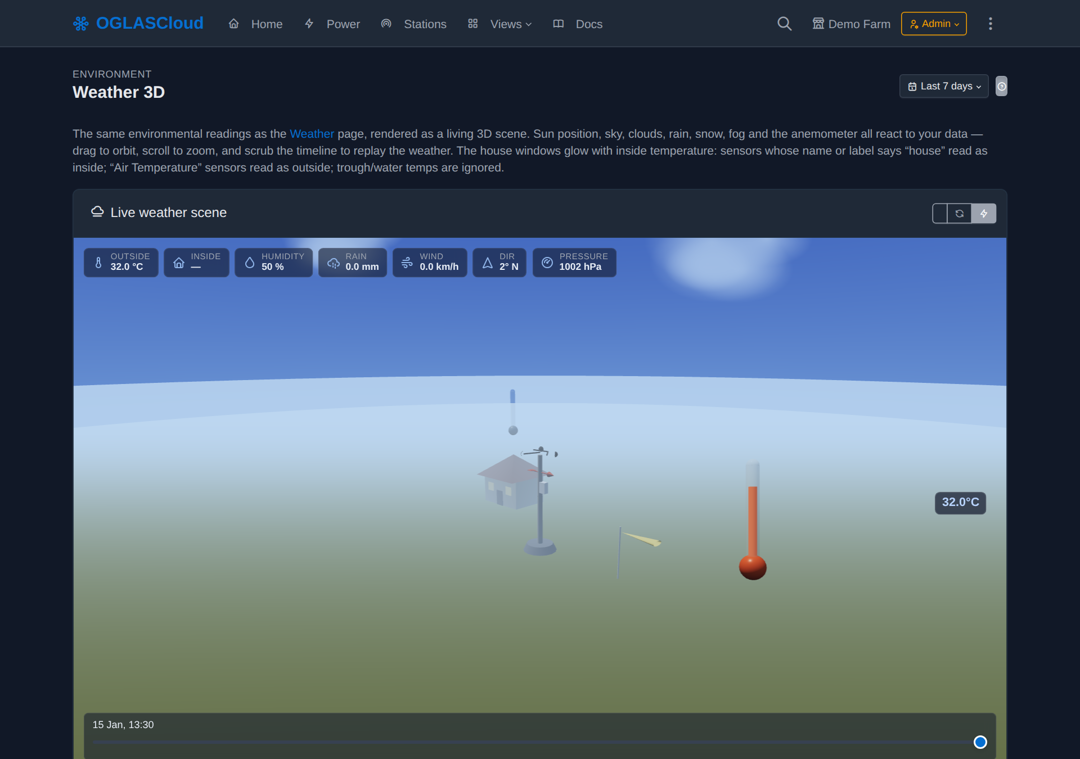 Weather 3D — your readings as a living scene
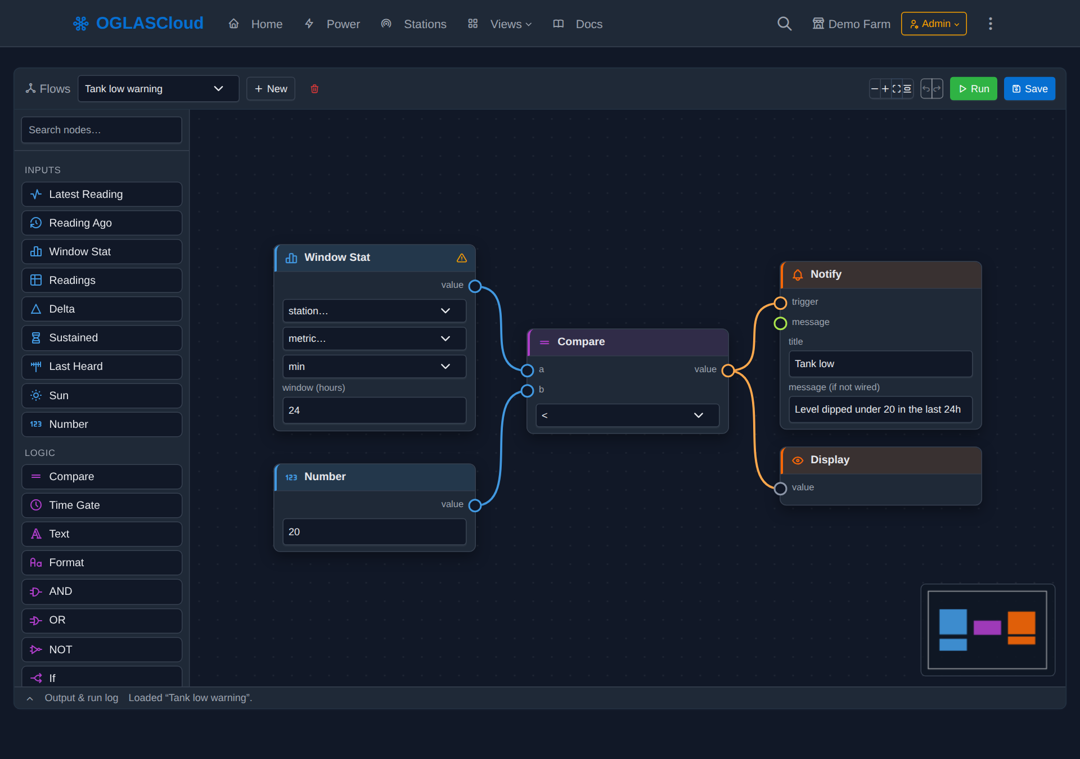 Flows — wire up an automation without writing code
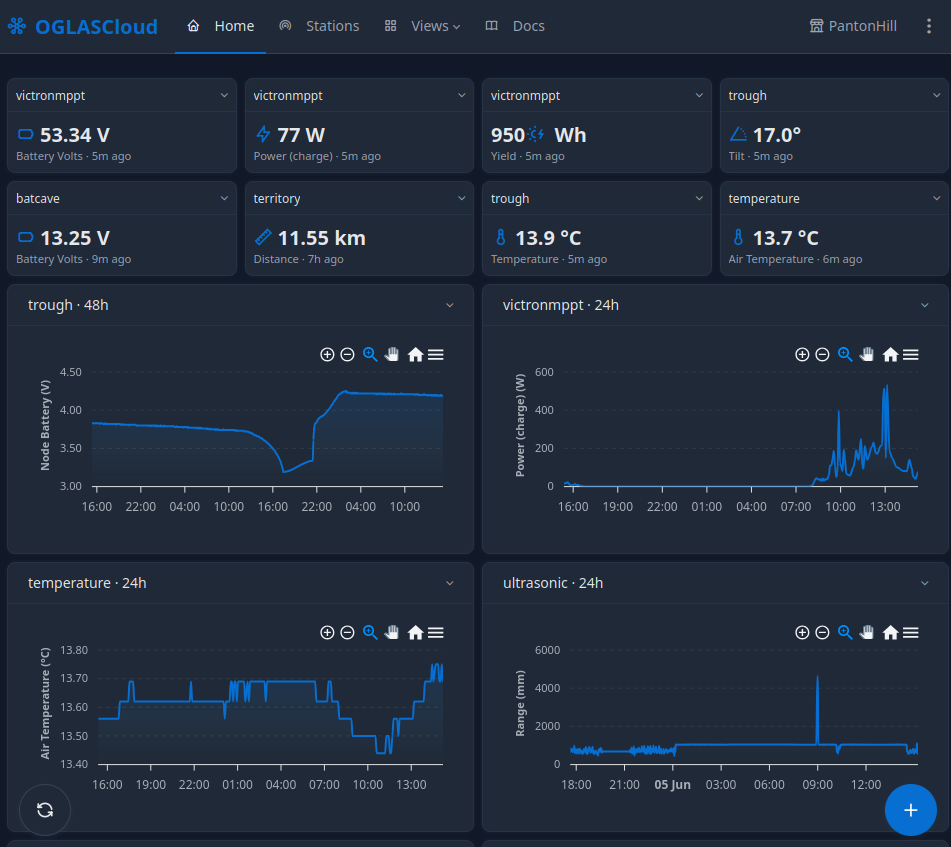 A live overview, built your way
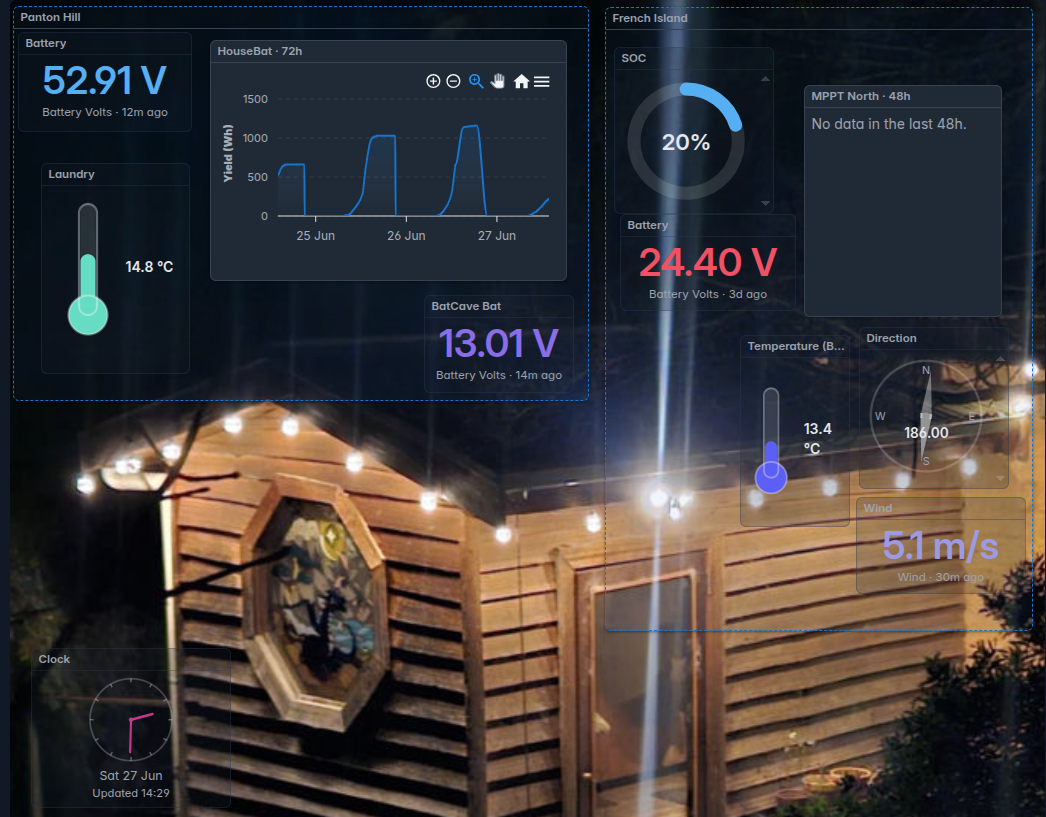 Customise the dashboard any way you like — including values from multiple sites
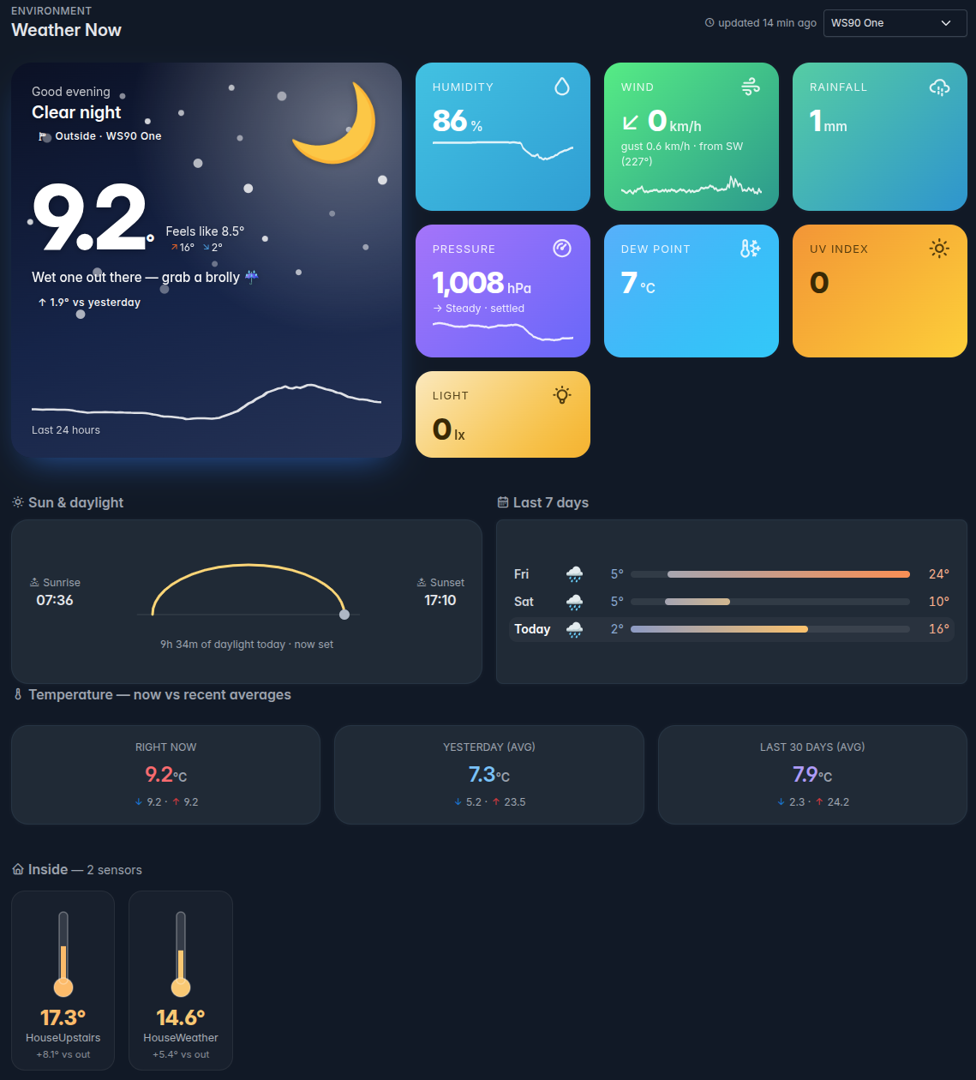 Weather Now — a live summary at a glance
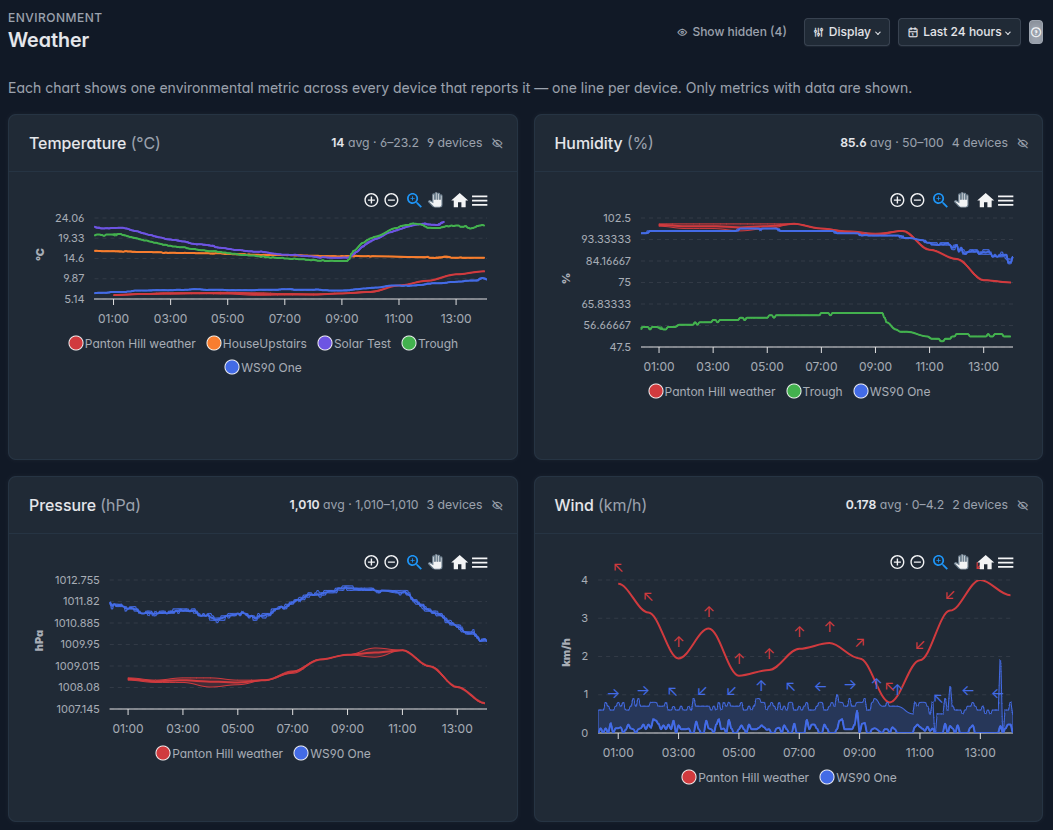 Beautiful and customisable weather views
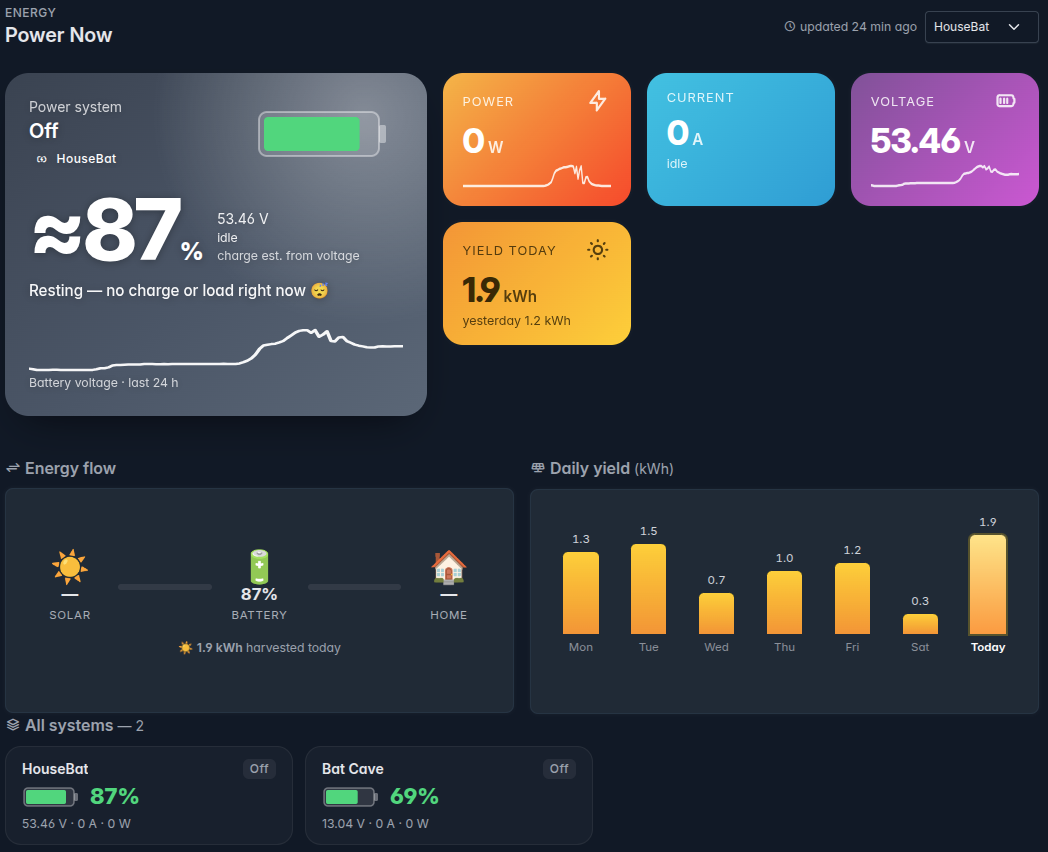 Power Now — live battery, current and yield
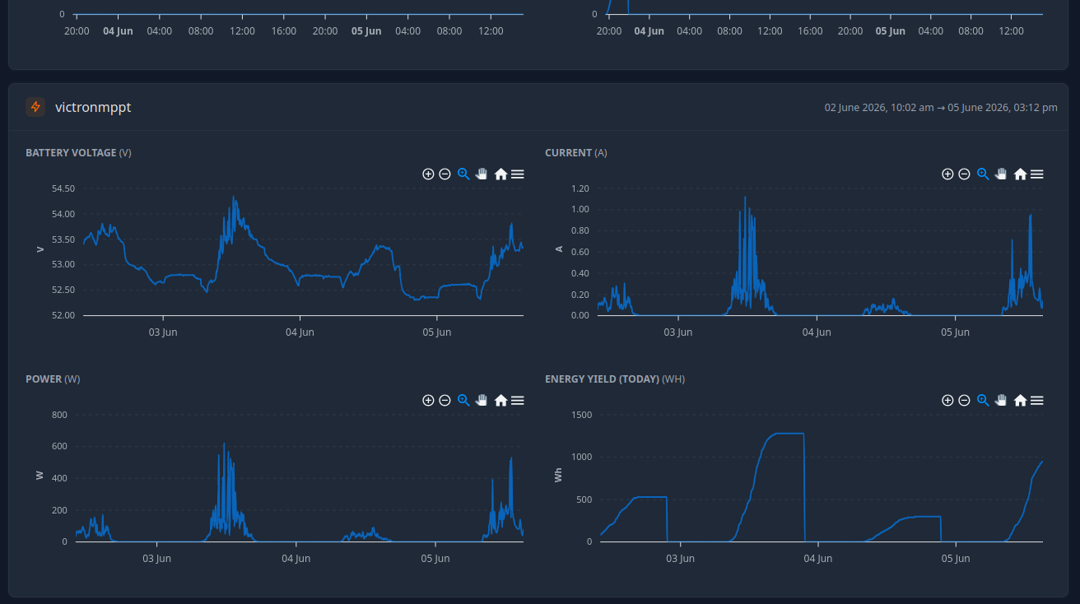 Power — battery, current and solar yield
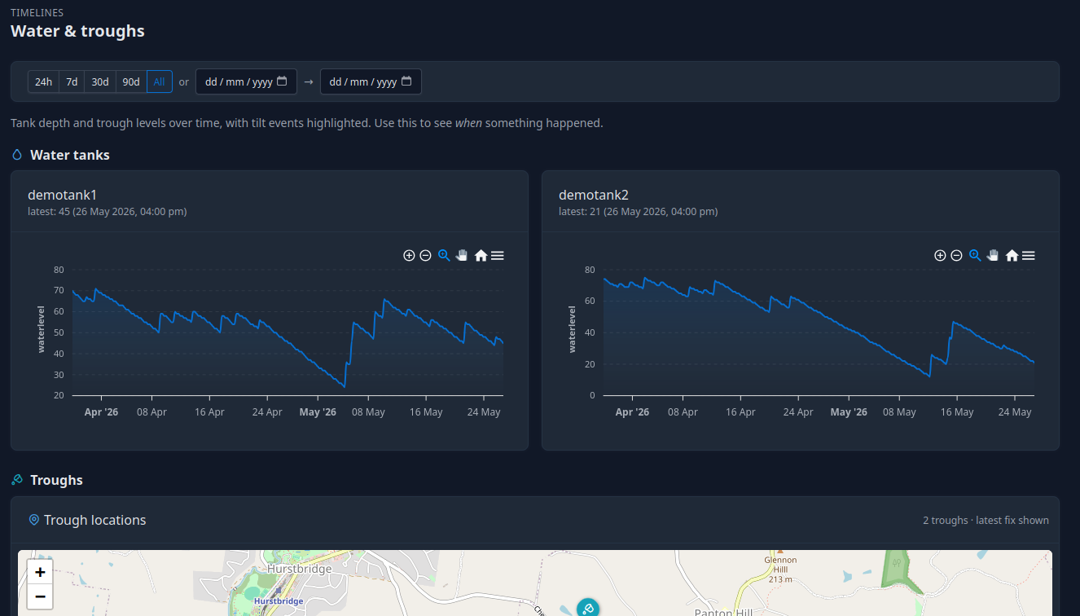 Water — tanks and troughs over time
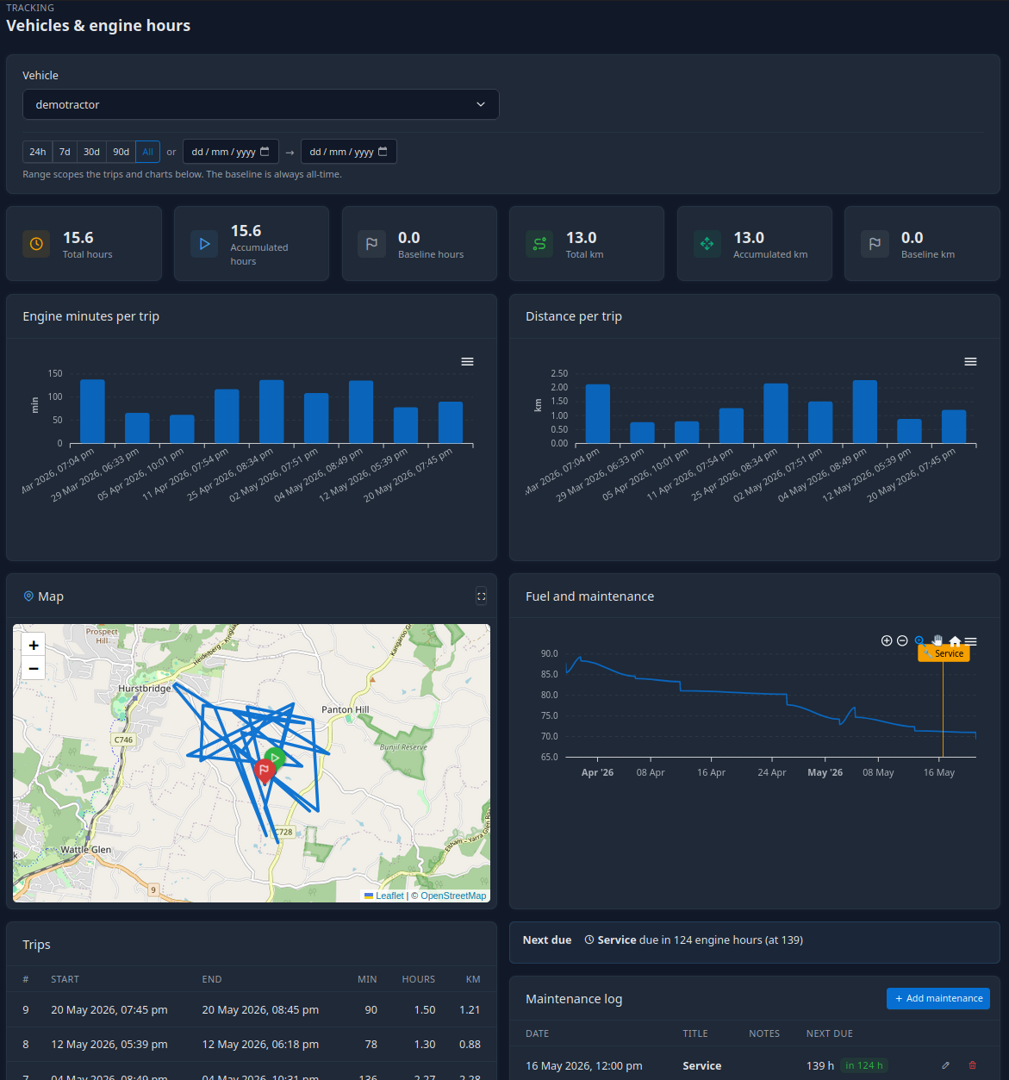 Vehicles, trips and engine hours
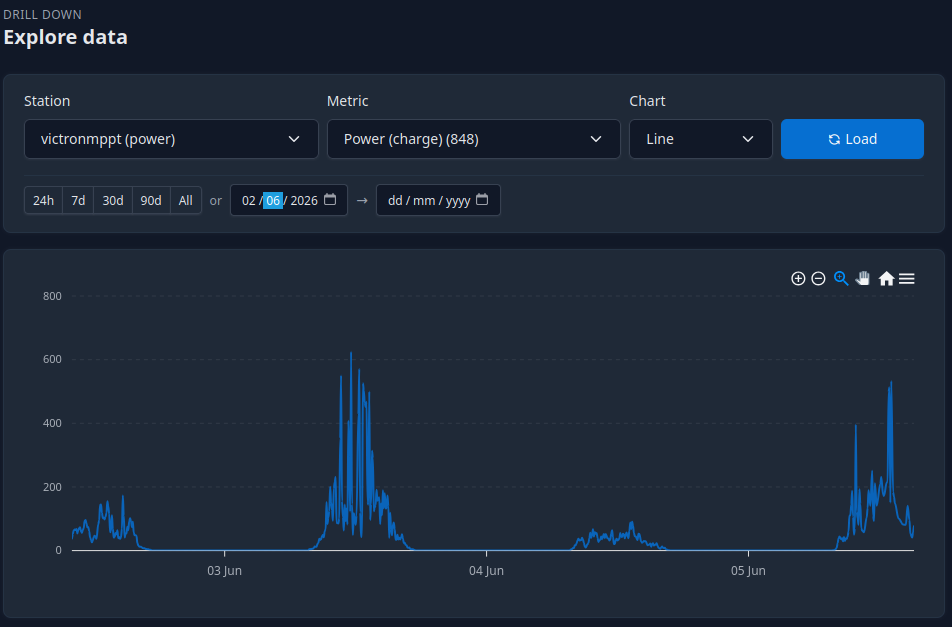 Explore any station, metric and range
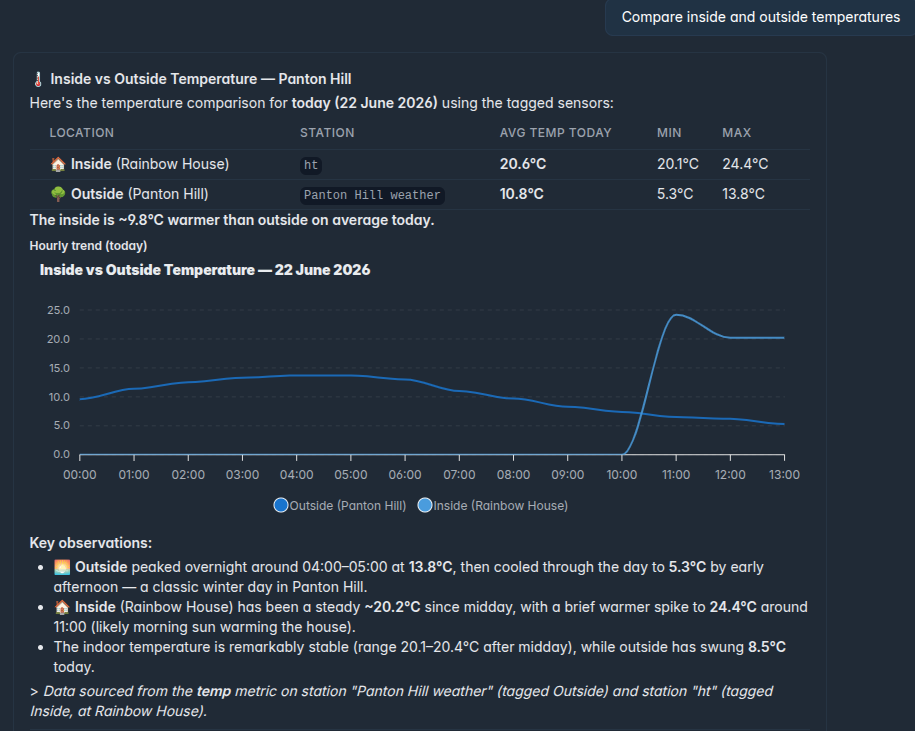 Ask your data a question, in plain English
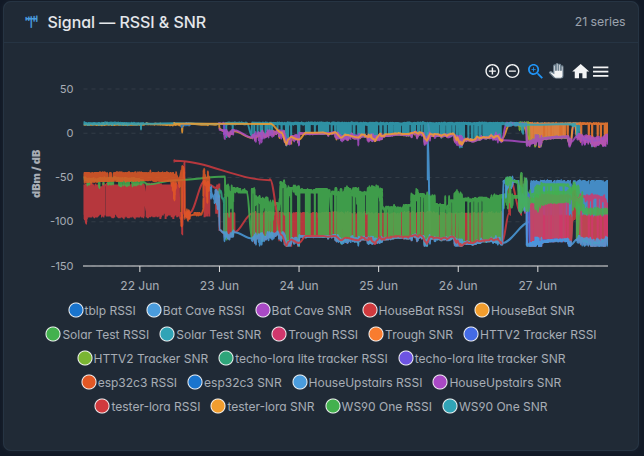 Signal — link and mesh health across every device
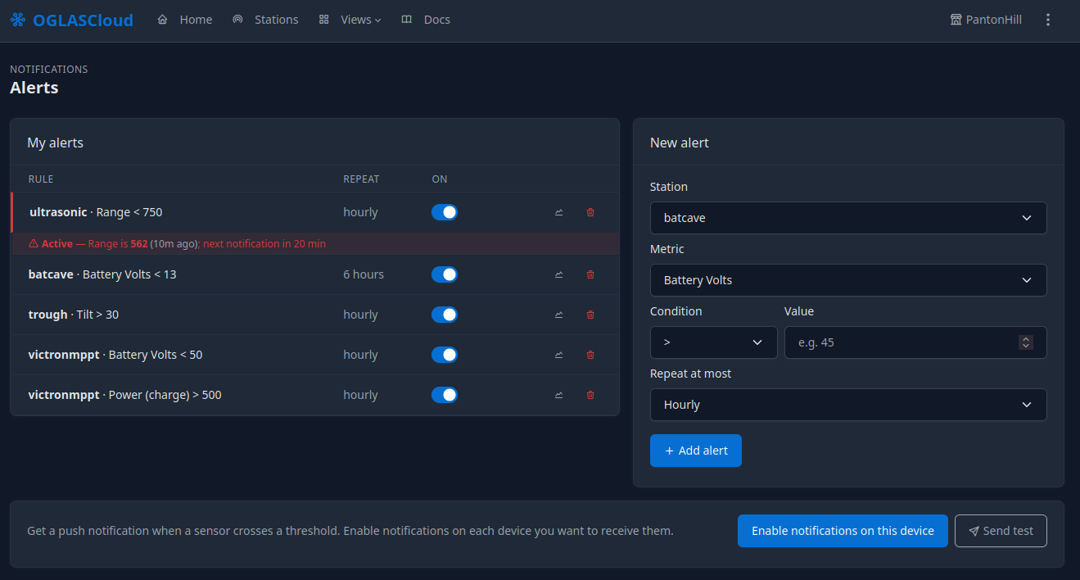 Threshold alerts that reach you
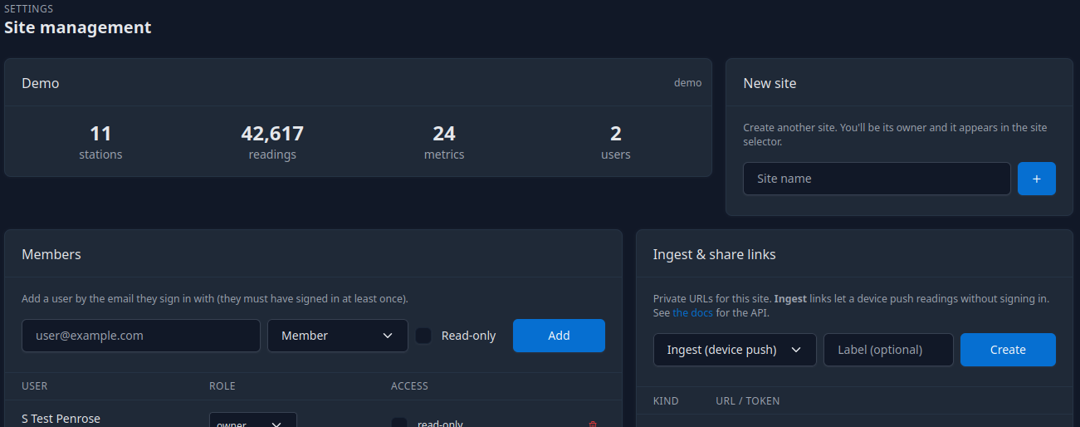 Many sites, shared on your terms
How the data gets there
A hub on a remote site needs a way out. OGLAS supports several, and the right one depends on what your site has:
- Mobile / LTE — a SIM in the hub where there’s mobile coverage. Simple and cheap where it’s available.
- Wi-Fi / Ethernet — if the site already has internet from a local provider, the hub just uses it.
- Satellite — for sites with no terrestrial option at all. See the Satellite Hub.
- HaLow and other long-range links — Wi-Fi HaLow (902–928 MHz) and similar long-range options can carry data from a hard-to-reach hub to a point that does have a connection, without a telco in the field.
Whichever path you use, only what you choose to send goes up — the full-resolution record always stays local on site.
What Cloud gives you
- A full private copy — your data kept safely off-site, available now and into the future. A second home for your history, beyond the on-site backup.
- Remote access from your phone — check the site while you’re in town, on another property, or on the other side of the country. The trough that’s low, the forklift that’s idle, the battery that’s dropping — without driving back.
- Sharing, on your terms — give another person a view: a business partner, a contractor, a family member, a client. They see what you allow, and nothing more.
- Still yours, still private — no account holds your data hostage, no “premium tier” gates your history. Sharing is something you switch on, per person, per view.
A look at it
OGLASCloud is the web app behind all of this — the same data, reachable from a browser anywhere or installed on your phone.
From anywhere, on any screen
The home view is a live overview of the site, built from the cards and charts you care about:
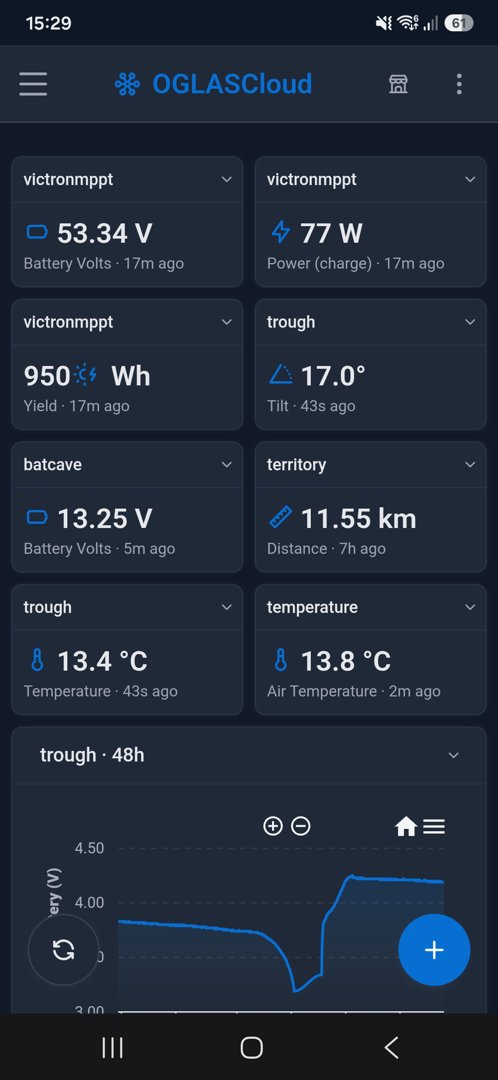
The same dashboard travels to your phone, for when you’re away from site:
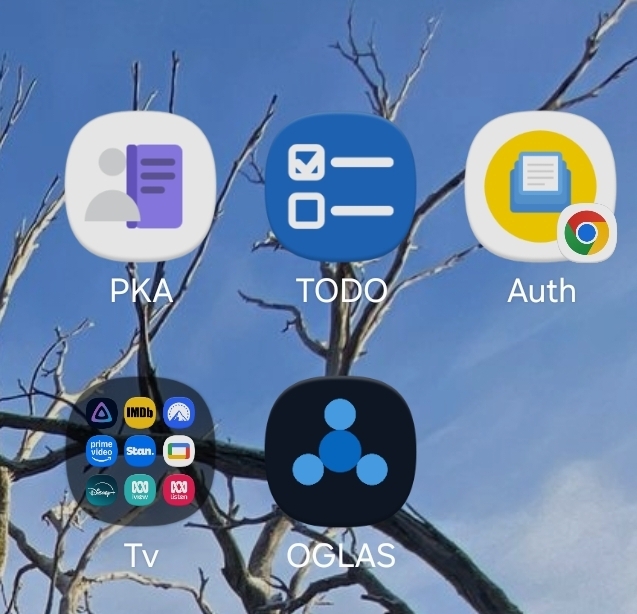
It installs like any app — one tap to your sites:
Draw your property, make it live
Spaces are dashboards laid out on a picture of your place — the tank widget on the tank, the battery gauge on the battery shed, the weather card over the paddock it stands in. Full screen on the kitchen tablet, it’s a kiosk; on a TV, it rotates through the screens you choose:
The park-map view of your farm
The live Map puts every station on satellite imagery with its current value on the pin — tanks, batteries, gates, weather — with signal, wind and trail overlays a click away:
And the Tracker follows one vehicle or animal at a time: its real trail on satellite, distance travelled, time moving versus standing still, live over the radio link:
Weather you can walk around in
Weather 3D renders the same readings as a living scene — sun position, cloud, rain and the anemometer all react to your data, and you can scrub back through the timeline to replay the day:
Automations without code
Flows wire readings to actions on a canvas: take the 24-hour minimum of a tank level, compare it to a threshold, send the notification. Starter templates cover the common ones — frost alert, tank low, daily check:
Dig into the data
Drill into any station and metric, over any time range:
Purpose-built views pull the right sensors together. Power opens on a live “now” summary — state of charge, current, voltage, and the day’s yield at a glance:
…and drills into the detail — battery voltage, current, charge power, and daily yield from a Victron MPPT:
Weather opens the same way — a live conditions card with feels-like, wind, rainfall, pressure and the day’s sun, wrapped in a sky that matches the moment:
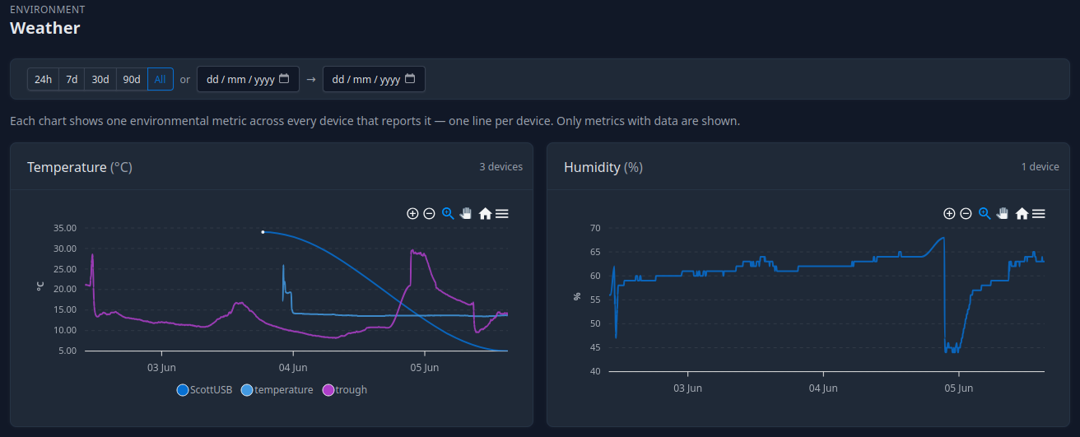
Underneath, each metric is charted across every device that reports it, one line per device. Beautiful, customisable, and only the metrics with data are shown:
Drill into the history of any single metric across devices and time:
Water and troughs over time — tank depth, trough levels, and trough locations on a map:
Vehicles and engine hours — trips, distance, fuel and maintenance, plotted on a map:
And keep an eye on the network itself — signal strength and noise (RSSI & SNR) for every device, so you can see a link degrading before it drops:
Ask your data
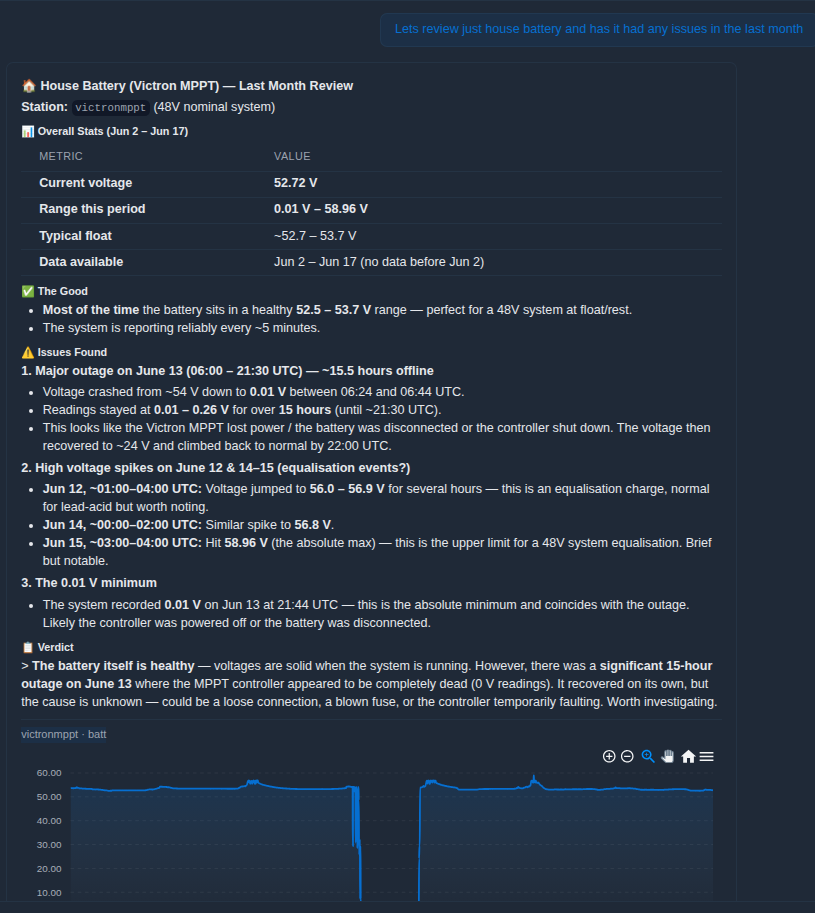
Not sure which chart to open? Ask in plain English and OGLASCloud pulls the right stations, works out the answer, and shows the chart behind it — compare inside and outside, review a battery’s month, or check whether a reading crossed a line:
Alerts that reach you
Define threshold alerts per station and metric, repeated at most as often as you choose:
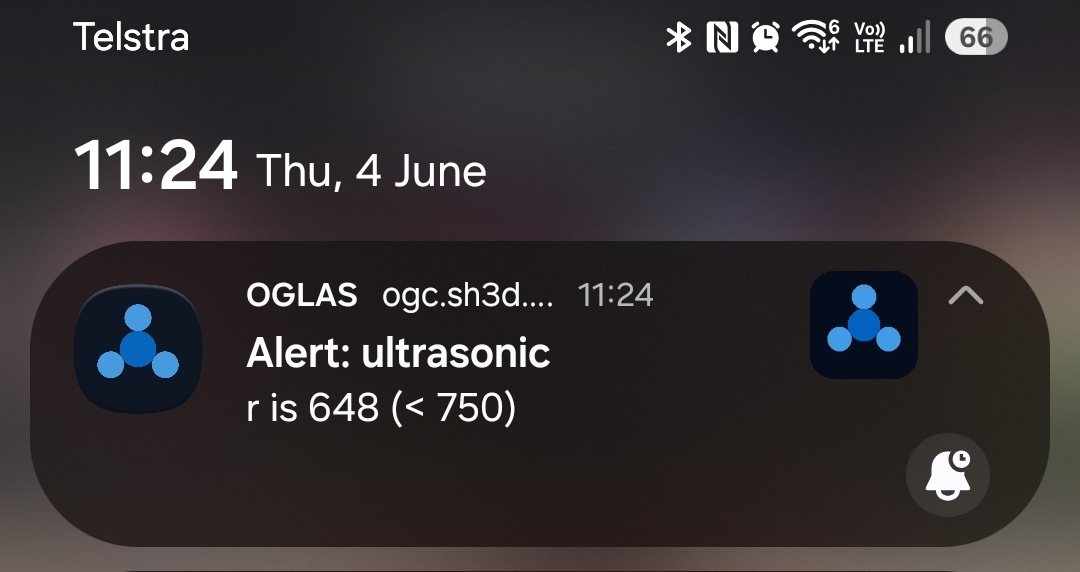
And get the push notification the moment one trips, wherever you are — here an ultrasonic level dropping below 750, delivered over LTE:
Many sites, shared on your terms
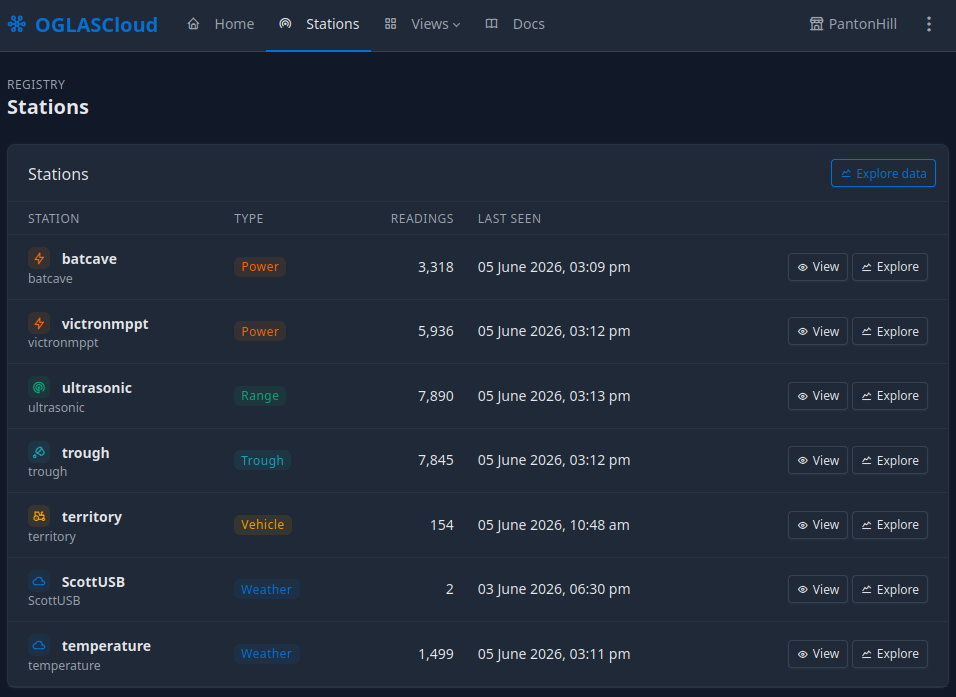
Manage every station on a site — its type, reading count, and when it was last seen:
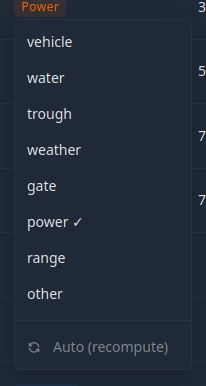
Classify a station so its data lands in the right view:
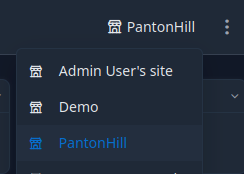
Switch between every site you own or have been given access to:
And share on your terms — add members by email, set read-only access, and create private ingest and share links:
See it in action
A full walkthrough of the OGLASCloud dashboard — every screen, from the live overview to station management and sharing:
Or the quick 30-second tour:
Local first, Cloud optional
The two halves work together:
- Local is the source of truth — full data, full analysis, on your hardware, always.
- Cloud is the off-site copy and the remote window into it — added when you want reach beyond the site, left off when you don’t.
Want a specific cloud setup — your own server, particular sharing rules, an integration with something you already run? That’s a custom build.